


 Map anything in Tableau with images!
 Map anything in Tableau with images!
Imagine having instant access to your solar energy performance with just a click. Our innovative Solar Panels Dashboard — with a dynamic and interactive visualization using images in Tableau — leverages cutting-edge predictive maintenance and advanced visual analytics, enabling users to effectively monitor and optimize solar energy production across a hypothetical neighborhood. Here in this post we’ll explore the transformative impact of incorporating background images in your dashboards and discover how it can elevate your analytics experience.
Tableau & Background Images
Basically incorporating background images in a Tableau dashboard is not rocket science and it can greatly enrich your dashboards by enabling you to create highly customized visualizations. By mapping data points to specific coordinates, you can display your data onto your images in a meaningful way. Here’s my quick guide on how to start mapping your own images.
Just follow the quick steps below:
- First of all, check your image size by right-clicking the file and selecting ‘Properties.’
- Create an Excel with the following columns: Point, X, Y
- Connect Tableau to this file and place both X and Y measures to Columns and Rows
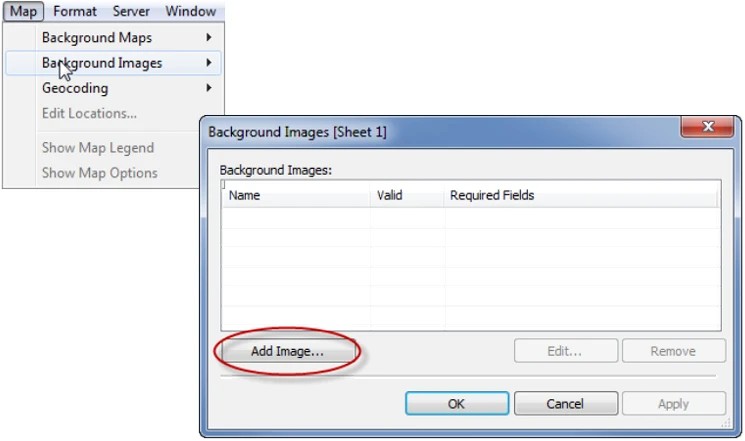
- Add an image to Tableau (check the image below) and edit the axis size to the exact same size of the image.
- Use Tableau to locate each point of the area you want to display on the image (hint: use the function ‘annotate point’)
- Register each single X and Y coordinates to the Excel and reload it in Tableau. Done!
If you want to learn more details on how to use a background image to enhance your analysis, check out this page from Tableau: Use Background Images in Your Views. Or contact us HERE.
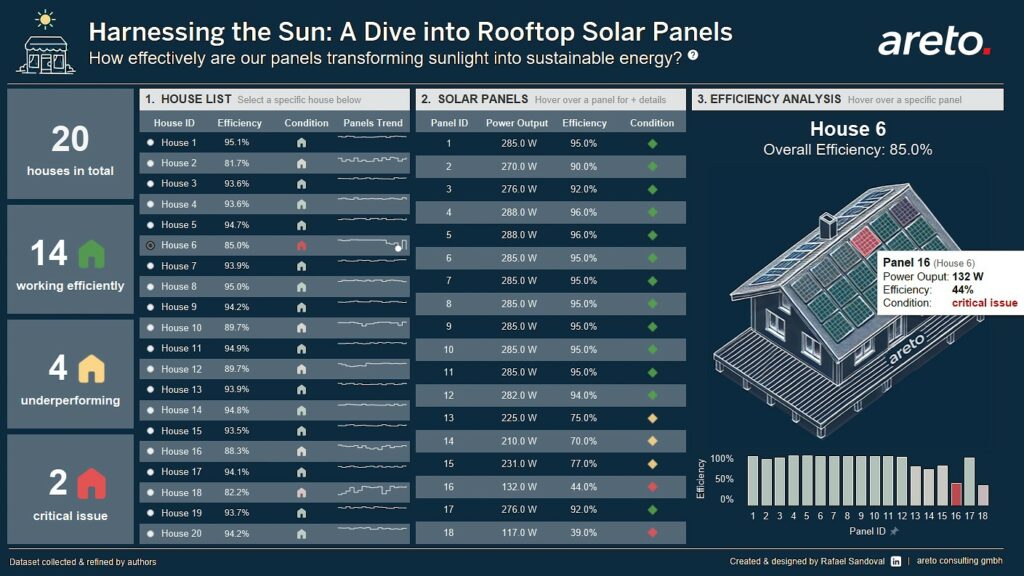
Dashboard Example: Solar Panels
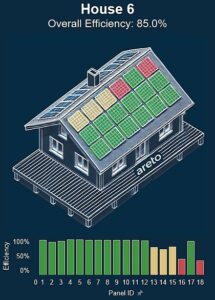
Through metrics such as Power Output and Total Efficiency, users can assess how effectively each panel converts sunlight into usable electricity. For instance, values above 90% indicate optimal performance, those between 70% and 90% may signal potential issues (like dirt buildup or shading), while critical issues are flagged when efficiency falls below 70%, indicating possible malfunctions. Utilizing a customized image, X-Y coordinates, and analytical skills, this dashboard transforms raw data into insightful visuals. This can allow users to monitor solar panel performance in real-time and develop efficient maintenance strategies.
Check out the dashboard here: Harnessing the Sun!
Beyond solar panel analytics, Tableau’s capabilities with images, mapping, and coordinates extend into diverse fields, showcasing its versatility as a powerful visual analytics tool. By creatively using background images with mapped coordinates, you can gain insights in various industries:
- Fleet Management: Analyze vehicle performance data, fuel consumption, and maintenance history to predict when vehicles will need servicing.
- Oil & Gas Industry: Monitor pipelines and drilling equipment for wear and tear, predicting leaks or necessary repairs before they happen.
- Data Centers: Analyze server performance and cooling systems to prevent overheating and ensure optimal up and down time.
- Human Anatomy: Map the human body with coordinates to analyze muscle activity, monitor physical rehabilitation progress, or visualize the effects of different treatments on specific body parts.
With Tableau’s ability to rapidly decode latitude and longitude pairs, users can plot their data directly into images, making it easier to visualize complex information.
Ready to take your Tableau dashboards to the next level?
At areto, we specialize in providing personalized support to enhance your data analysis skills, all backed by our team of BI experts. Whether you need help with integrating images or optimizing your visualizations, we’re here to assist you. Schedule an appointment with one of our experts HERE and unlock the full potential of your dashboards!